
PROBLEM
Public music school enrollment in Germany has grown for a decade, but is growth outpacing the system's capacity, and is access equal across regions?
ACTION
Sourced and cleaned 10 years of Destatis data across 5 datasets (national/regional enrollment, staffing, age groups, population); built a star-schema data model in Power BI; designed an interactive dashboard with year and region drill-in navigation.
RESULT
Participation rose 1.65% → 1.83% of population (+150K beyond demographic growth), while teaching staff fell 5%, pushing student-teacher ratios from 34:1 to 42:1. Regional access varies more than 3x (Baden-Württemberg 2.77% vs. Bremen 0.65%).
Context:
In 2012, the Kultusminister der Länder in der Bundesrepublik Deutschland (KMK) and the Bundesministerium für Bildung und Forschung (BMBF) jointly published "Bildung in Deutschland 2012," a national education report with a special focus chapter on cultural and music education.
The report explicitly identified music schools as a key pillar of non-formal cultural education in Germany, and highlighted equitable access as a policy priority.
This analysis begins in 2013, the year following that report's publication, and examines whether the decade that followed saw the participation growth and equitable access the report called for.
Objectives:
Track enrollment vs. population growth
Assess staffing capacity vs. demand
Observe enrollment by age groups
Compare regional access across Bundesländer (States)
German Public Music Schools 2013 - 2023
Data Source:
Destatis GENESIS-Online
The Statisches Bundesamt is the official federal authority for collecting data in Germany.
Data on public music schools were pulled from the Verband Deutscher Musikschulen (VdM).

Data Cleaning and Transformation:

Data Modeling:

-
Missing values were evaluated and filled based on context
-
No duplicates or mixed values found
-
Data sets were transformed for a unified set of key columns to facilitate data modeling
-
Star schema model created on Power BI model view
-
3 Fact Tables created with key values for Year, Bundesland, and Age Groups
-
One-to-Many relationships connect all six Destatis tables to three fact tables.
Limitations:
The data represents only the portion of the German population who attend public music schools and does not account for access to private music education.
Data Source and Methodology
Rise in enrollment over a decade:
-
Between 2013 and 2023, enrollment grew steadily, with participation rising from 1.65% to 1.83% of the population, equivalent to roughly 150,000 more students than population growth alone would explain.
-
This growth was interrupted only by the COVID-19 pandemic, with enrollment dipping in 2020–2021 before recovering to pre-pandemic levels by 2023.


Rising demand not matched by staffing:
-
The number of teachers fell about 5% over the decade, from 38,762 teachers nationwide in 2013 to 36,747 in 2023.
-
This decrease in staffing pushed the average student-to-teacher ratio from 34:1 to 42:1. The rising ratio is not necessarily a capacity strain, as there is no specification on the number of group lessons.
The Tension Between Enrollment and Staffing
School children at the core of demand:
-
Demand is heavily concentrated among children aged 6–10 (16.5% of that age group), tapering off through the teenage years.
-
In the state of Nordrhein-Westfalen, which has one of the highest overall attendance rates, almost 25% of all children aged 6-10 are enrolled at a music school.


Regional access is highly uneven:
-
Baden-Württemberg, with the highest enrollment rate of 2.77%, far outpaces the state with the lowest rate, Bremen at 0.65%.
-
School count does not explain the disparity. Another city-state of Hamburg also has 2 schools, but a significantly higher number of teachers as well as higher participation.
Age Demographics and Regional Disparity
Line charts with enrollment and staffing trends and custom tooltips highlighting main findings

Tooltip over 2023 in the enrollment chart

Navigation bar to detail pages
Bar chart displaying distribution of students by age group
Matrix chart with metrics by state and conditional formatting for visual clarity
Dashboard Design - The Landing Page

Yearly Detail Page
-
Multi-cards shows key metrics
-
Bar chart for age groups
-
Matrix chart for ranking enrollment rate by state
-
Slicer to change years
Bundesland Detail Page
-
Interactive map with parameters of five metric selections
-
Cross filter from map to multi-cards and bar chart
-
Information buttons bookmark insights on specific regions

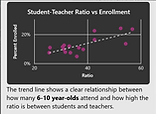
Custom tooltip shows correlation between number of students and student-teacher ratio
Detail Pages on Year and Region
RECOMMENDATIONS
Prioritize an investigation into Bremen’s low participation rate
A targeted review could clarify whether this region’s access gap is structural, financial, or demand-driven.
Monitor student-teacher ratio as a staffing-adequacy indicator
If the ratio continues to rise without pedagogical grounds (increase in group instructions), it might point to strain in service quality.
Use Baden-Württemberg as a benchmark to inform on strategies
With 211 schools and highest enrollment rates, understanding what drives its outcomes can benefit lower-performing regions
NEXT STEPS: Investigating Funding
Explain the Bremen/ Hamburg gap
Compare funding per school or per person across regions – is Bremen’s low participation rate due to underfunding, or another structural cause?
Test the staffing story
Cross check the funding trends with the 5 % decrease in staffing - did the funding stagnate or drop? How does funding compare to teacher-student ratio?
Break down by funding source
Separate federal, state and municipal funds – does high-performing Baden-Württemberg have a different combination of funding than low-performing Bremen?