
Overview
Context:
Spotify is one of the most popular music streaming apps today. There is ample data collected on artists and songs on its platform.
An exploration of the top hits over two decades aims to discover trends and patterns of the most popular songs.
Key Questions:
-
Where do most popular songs come from?
-
Which audio features define a top hit?
-
How has the music changed over the years?
-
Can we predict how popular music sounds in the future?
Data:
Spotify Top Hit Playlist 2000 – 2023,
Music Artists Popularity Data Set
Skills:
Data cleaning & wrangling, exploratory & predictive analysis, machine learning models, dashboard creation
Tools:
Python, Tableau


Process:
-
Preparing the data – cleaning and wrangling
-
Exploratory visual analysis – finding correlations
-
Regression analysis – testing a hypothesis
-
Time series analysis – testing for stationarity
-
Geospatial analysis – visual insights through mapping
Sourcing and Preparing Data
Primary Data Set:
-
Sourced from Kaggle
-
Top 100 hits per year on Spotify from 2000 – 2023
-
23 variables, including audio features such as danceability, energy, key, mode, loudness, duration, tempo, valence, acousticness and danceability
-
Collected through Spotify API
Secondary Data Set:
-
Sourced from Kaggle
-
Data on more than 1.4 million artists
-
Variables on artists, including name, country, tags, and popularity
-
Collected from the MusicBrainz database and webscraping last.fm
Merged Data Set:
-
Data checked for missing values and duplicates
-
Wrangling procedure to prepare for merge
-
Merge on Artists’ Name
-
Missing values in ‘country’ variable filled using assistance from ChatGPT
Exploratory Visual Analysis
Relevant variables were placed in a correlation matrix heatmap with the following results:
-
Strong positive correlation (0.69) between energy and loudness
-
Strong negative correlation (-0.55) between acousticness and energy
The correlations were visualized through scatterplots.
The relationship between energy and acousticness was chosen for further exploration.
Hypothesis:
The more acoustic a song is, the less energy (or calmer) it feels.


The data was split into a training set and test set (70/30).
A linear regression model was applied to the training set based on the following hypothesis:
The more acoustic a song is, the less energy (or calmer) it feels.

-
The negative slope confirms the negative correlation between acousticness and energy.
-
The low MSE shows that the model’s predictions are close to the actual values.
-
The low R2 score indicates that this model cannot explain almost 70% of the variances in the data: the model is a poor fit.
Interpretation of results:
Acousticness alone does not explain energy level of a song. For the complexity of this case, a more advanced multiple linear regression model may prove a better fit.
Slope: -0.42
MSE: -0.019
R2 score: 0.309
Linear Regression
Acousticness over time:
The introduction of electronics to music came only in about the last half century and is a relatively young genre in the long history of music.
Has the use of acoustic instrumentation continued to decrease since the beginning of this millenium?
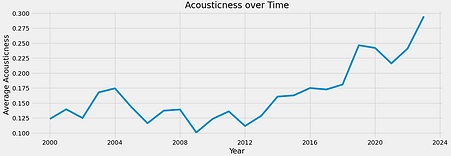
Surprisingly, average acousticness of the top hits since 2000 show a rise in the last decade.
It seems that the electronic age may have peaked in the early 2000’s and acoustic instrumentation is now making a comeback.
Stationarizing the time series:

The decomposition of the time series show a slight upwards trend, with no seasonality nor residuals.

Even after differencing, this time series could not be stationarized.
Conclusion:
This time series is not suitable for forecasting.
Time Series Analysis
Geospatial Analysis


Key takeaways from the geospatial analysis:
-
The USA is home to the highest number of top hit artists.
-
English-speaking countries (USA, UK, Canada and Australia) dominate in total number of hits over the last two decades.
-
South Korea starts to gain significant numbers of top hits after 2019 and currently produces the highest number of popular artists in Asia.
Where do the top hits come from?
Please click here to visit the interactive version of this map on Tableau.
Conclusions
Key Insights:
-
American artists continue to top the charts in popular music.
-
The last two decades have been a flourishing time for electronic (non-acoustic) music that are high in energy.
-
Acoustic instrumentation has gradually returned over the last few years.
-
The data doesn’t allow for forecasting, therefore we cannot predict how music will evolve in the future.
Next steps for further analysis:
-
Perform an advanced multiple linear regression model on multiple audio features.
-
Observe and compare audio features of top hits by various artist's nationalities.
Project Assessment:
The accuracy and reliability of the data on audio features are highly dependent on the specifications of Spotify's algorithms.
Ultimately, the data proved unsuitable for various models, such as linear regression, cluster analysis and time series forecasting.
Although these limitations created challenges in producing the insights to popular music I was hoping for, it reminded me that music is an art, and numbers cannot always capture the essence of art.
The Tableau Storyboard and GitHub Repository are available to view: