
Overview
Context:
Rockbuster Stealth LLC* is a movie rental company looking
to launch an online video rental service in order to stay
competitive with online streaming services such as
Amazon Prime and Netflix.
Objectives:
The Rockbuster management would like to have a better
understanding of their customer base. They have business
questions and expect data-driven answers to use for their
launch strategy.
Role:
Data analyst for Rockbuster’s business intelligence
department, tasked to help with the launch strategy for
the new online video service.
*This project and data set were created as part of the CareerFoundry data analytics course.
Data:
Rockbuster data set*
Skills:
data modeling, data cleaning and summarizing, database querying, data visualizations, reporting
Tools:
PostgreSQL
Excel
Tableau
Process:
-
Understanding the data structure
-
Exploring and preparing the data
-
Answer business questions through queries
-
Report findings and offer recommendations


Understanding the Data
-
The Entity Relationship Diagram of the Rockbuster database shows the relationships between the various tables and how they are linked.
-
Creating a data dictionary helps to clarify the complex relationships and define the data within each table.
-
The data dictionary serves as a reference document for the data analyst when accessing and querying the database.

Entity Relationship Diagram, extracted using DbVisualizer

Example from the data dictionary created for this project.
Exploring the Data
Data Cleaning: the data was checked for
duplicates, missing values or inconsistencies.
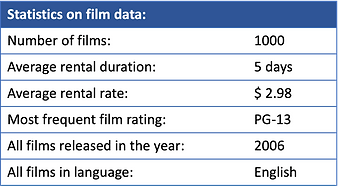
Exploration: summary statistics were
made on various tables:


Answering Business Questions
More complex queries use filtering, joining tables, or nesting subqueries to answer some of the management’s key questions.
Who are our most valued paying customers?
Which movies bring in the most revenue?

Snapshot of the SQL query input


An Excel Workbook with all SQL queries and results are available by request.
Data Visualization
Which countries have the most customers?
Which countries bring the most revenue?
Visualizing the result of a query can illuminate a pattern that may otherwise go unnoticed!

Number of Customers and Total Revenue by Country
Largest customer and revenue base in Asia, despite all films being in the English language.

Click to view the interactive map on Tableau.
Recommendations for Launch:
Following my exploratory analysis, these are some recommendations I would make to the Rockbuster launch team:
-
Invest more advertising for the new platform in countries with the highest number of customers (India, China, US).
-
Feature top revenue films on the front page of the online site.
-
Expand and update the Rockbuster inventory to include films in more languages and release years.
-
Retain valued customers when transitioning to the online platform by offering top payers a reward or discount.
Project Assessment:
Through this project, I learned about the challenges in accessing data from a relational database. It is very important to understand the structure of the database, as it can be quite complex.
The various business questions gave me an opportunity to refine my SQL programming skills, especially in the task of joining tables and performing subqueries.
The frame of the project allowed me to answer the business questions presented, but I would have liked to further explore follow-up questions such as:
-
Which films are most popular in the top countries?
-
Are there film ratings that produce more revenue?
Conclusions
The final project presentation and GitHub Repository are available to view: