
Overview
Context:
Berlin’s S-Bahn is the rapid transit network connecting the city center with surrounding neighborhoods. With 6 lines and 10 starting stations, the S-Bahn recorded over 131,000 trips in 2024. This project analyzes those trips to identify the factors driving delays and cancellations throughout the year.
Objectives:
-
Identify which S-Bahn lines and time periods experience the most delays
-
Examine delay patterns by time of day, weekday, and month
-
Investigate the impact of incidents, weather, and strikes on punctuality
Data:
Berlin S-Bahn Multi-Table Dataset (Kaggle)
Skills:
Data cleaning and summarizing, database querying (CTEs, multi-table joins, aggregate functions), reporting
Tools:
PostgreSQL
Excel
PowerPoint


Process:
-
Understanding the data structure
-
Exploring and preparing the data
-
Answer business questions through queries
-
Report findings and deliver insights
Exploring the Data
Relational database with 7 interconnected tables – all cleaned and checked for missing values and duplicates.
A creation of an Entity Relationship Diagram (ERD) on PostgreSQL clarified the connections between the tables. Some of the tables, such as strikes and weather, had to be joined to the trips table through timestamps.
Multi-table relational dataset:
Table Statistics:
131,771 trips for the year
36 recorded incidents
10 main stations
8,761 hourly weather records
6 lines in the network
6 recorded union strikes
3 large city events
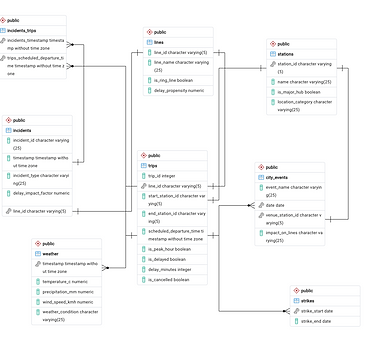
Entity Relationship Diagram
Key Statistics on Delays:
Average delay: 2.81 min
Median delay:
1 min
4% trips marked ‘delayed’ (> 5 min)
Delays by Lines and Incidents (Infrastructure)
Lines:
The S41 and S42 (Ring Bahn) have the highest rates of delayed trips (82%) and cancellations across all 6 lines.

The Ring Bahn’s circular route serves dense residential areas with more stops and transfer points, increasing exposure to disruptions.
Incidents:
Power outages carry the highest incident impact factor (9.88), far above signal failures (4.73) and track maintenance (2.47).
A correlation test is run between delay impact factor and delay minutes. The CTE defines the time frame between one hour before an incident and one hour after the incident.
Query: Correlation between Incident Severity and Delay Duration

Result: -0.11
=
No correlation, suggesting the impact factor is not measured by delay duration.
Peak hours (6:00–10:00 and 16:00–20:00) show a 92% delay rate versus 75% during off-peak hours.
Peak-hour delays are mostly 1–5 minutes — consistent with minor congestion from high traffic volume rather than major incidents.
Weekdays have higher average delays than weekends; commuter traffic is the main driver of minor delays.

Three months out of the year 2024 had significantly more delayed trips. These months coincide with major strikes by the GDL, a German trade union for train drivers.

How disruptive were the strikes on overall rates of delay and cancellation?
Delays by Hours, Days and Months (Time)
Forceful Impact of Strikes
Strikes are the biggest disruptor: average delay jumps from 1.5 minutes to 22 minutes on strike days, with a 10% cancellation rate.

Further investigation of outliers show that 90 % of all trips fall within the upper bound of 3.5 minutes.
Query: Identification of Outliers with the IQR Method

A low number of extremely high delays on strike days is distorting and skewing the dataset to the right.
Removing strike days cuts average delay by more than half and reduces the maximum delay from 1,181 minutes to just 13 minutes.
Summary and Deliverables
Key Insights:
-
Strikes are the single biggest disruptor — causing extreme delays and a high cancellation rate.
-
Peak hours are the primary driver of minor delays (1–5 min), pointing to commuter traffic as the root cause.
-
The Ring Bahn (S41/S42) is the most delay-prone line group, with the highest rates of delayed trips and cancellations.


Infographic:
Interactive Decision Tree
The full results of the analysis were delivered in two formats:
-
An infographic showing the five impact factors on S-Bahn delays.
-
A decision tree diagram (interactive on PowerPoint) showing hierarchy of impacts.
Project Assessment:
This project gave me hands-on practice querying a multi-table relational dataset in PostgreSQL, including joins, subqueries, and aggregation.
The most significant analytical decision was separating strike days from the rest of the data — this transformed the findings and produced a much more accurate picture of everyday S-Bahn performance.
This analysis also offered me experience in managing an end-to-end project: from inputting the data into PostgreSQL and forming an ERD, to cleaning data and querying for answers, and finally to summarizing findings in an Excel report as well as visual presentations on PowerPoint.
Next Steps:
Predicting delays: query a merged dataset and apply machine learning methods to explore whether delays can be predicted based on the various impact factors.
A full analysis workbook and query log (Excel) is available on request as well as on GitHub:
